Power BI: The Benefits, Features & More

For your business to thrive, you need flexible, adaptable apps and data solutions that scale to meet the growing demands of your business. At ivision, we use Microsoft Power BI to help clients build a data-driven culture by empowering teams with new business intelligence and data visualization solutions.
Power BI offers a lot of ways to transform data into knowledge. In this article, we’re sharing some of our favorite ways to do it. Let’s get started!
What is Power BI?
Microsoft Power BI is a powerful suite of business analytics products and services that include business intelligence (BI), reporting, and data visualization tools. It allows you to visualize data and share insights across your organization. Also, you can embed these insights in your app or website.
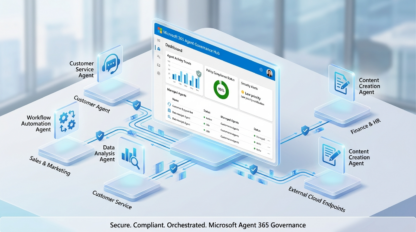
However, Power BI is much more than a data visualization and reporting tool. Power BI integrates with a number of other Microsoft solutions, such as Azure, Microsoft 365, Dynamics 365 and Power Platform as well as external data sources and apps to extend its use into AI/ML data science, and custom BI app building. So, you can combine multiple Microsoft services for your business without going through any complex procedures. For example, with Power BI’s cross-platform compatibility, you can share insights across Microsoft Teams and Excel.
With Microsoft Power BI, you can also get quick AI-powered answers to your business questions. In this case, it wouldn’t matter that you asked in conversational language. Power BI also lets teams work together on the same data reports and share insights.
Power BI comes in multiple platforms:
● Power BI Service
● Power BI Desktop
● Power BI Pro
● Power BI Premium
● Power BI Embedded
● Power BI Mobile
The Benefits of Power BI
At the 2021 Microsoft Business Application Summit, it was revealed that a whopping 97% of Fortune 500 companies now use Power BI. This statistic includes top brands such as Standard Bank, King’s College London, and Nestlé, all utilizing Microsoft’s Power BI platform.
With more users taking advantage of Power BI, it’s only natural to want to know what makes it so special. We’ve explored this amazing platform in more ways than one and can’t wait to show you all the benefits.
Here are our biggest benefits of using Power BI, and why our clients love it so much.
1. Easy to Get Startede
You’ll be able to get from raw data to insights pretty quickly with an uncomplicated setup, and the built-in dashboards for services such as Microsoft Dynamics, Salesforce, Google Analytics, Adobe Analytics and others.
2. Produce and Distribute Reports Fast
Tired of emailing large files and manually updating them into a shared drive? With Power BI, you can simply upload new reports to the Power BI service. Whenever the underlying datasets that feed the reports are refreshed, so are the reports, automatically.
3. Real-Time Insights
You don’t have to wait around and worry about how old and in-accurate report data is anymore. With Power BI, dashboards and other reporting tools update in real time, as connected data is pushed or streamed to the service. So, you can drive decisions based on the most current information, and have it flow across dashboards and other apps.
4. Connect and Combine a Multitude of Data Sources
With Power BI, you can bring in all the information you need to run the business. Sources of streaming data can range from factory equipment sensors and operational metrics, to employee satisfaction and training, to CRM, customer service and field services, and more. You’ll be able to connect a wide range of data types from many difference sources, internally and externally.
5. Extend Business Intelligence Value with ML / AI
With features like Quick Insights which help unearth trends in data and Q&A, businesses can get answers to their most important questions by simply asking questions. Power BI users can access image recognition and text analytics, create machine learning models, and integrate with Azure Machine Learning to extend the value of their analysis using powerful ML / AI capabilities.
Our Favorite Power BI Features
We know that choosing business intelligence tools can be challenging. For organizations new to the field, it could be quite difficult to know what to look out for. Therefore, we’ve curated our best Microsoft Power BI features.
Notably, though, some of these features are only available for some Power BI grades and we’ve let you know which one’s which. After reading through this list, these would most likely be your favorite Power BI features too.
Large Datasets for Research
Datasets refer to a single set of data created by taking information from multiple sources. Analyzing datasets on Microsoft Excel can get complex and slow because you may have to analyze data from over a million rows.
We loves Power BI’s Datasets feature because we can compress data, allowing us to extract insights from large datasets — we can analyze datasets from tens of millions of rows!
Nobody wants to spend all their time combing through the internet for a specific set of information. With Power BI, users can connect to multiple data sources and import data. Then, they can filter the datasets into smaller subsets containing only essential information. Organizations can get more extensive computing power and storage by purchasing Power BI Premium.
‘Get Data’ Feature
Get Data is another Power BI feature we find appealing and practical because it allows us to select what we need from a wide range of data sources — structured or unstructured. They could also be on-site or cloud-based data sources.
Here are some available data sources:
● Excel
● Power BI datasets
● SQL Server
● Access
● XML
● JSON
● Analysis Services
● Power BI dataflows
● Azure
Dashboards and Visualization Options
Power BI Dashboards are fundamental in Power BI Desktop. It’s the canvas on which you place different elements or visualizations. These visualizations represent datasets together. The Power BI Dashboard gives you a summary of the vital parts of a Power BI report. Notably, though, a Bi Dashboard is a single page, like other web-based dashboards.
We love Dashboards for the ease they bring to businesses. Creating a single-page overview of multiple-page reports simplifies the work of companies. Also, designers can create and publish Dashboards on sharing platforms. Then, teams and consumers can use the Dashboards while the designer reserves editing rights.
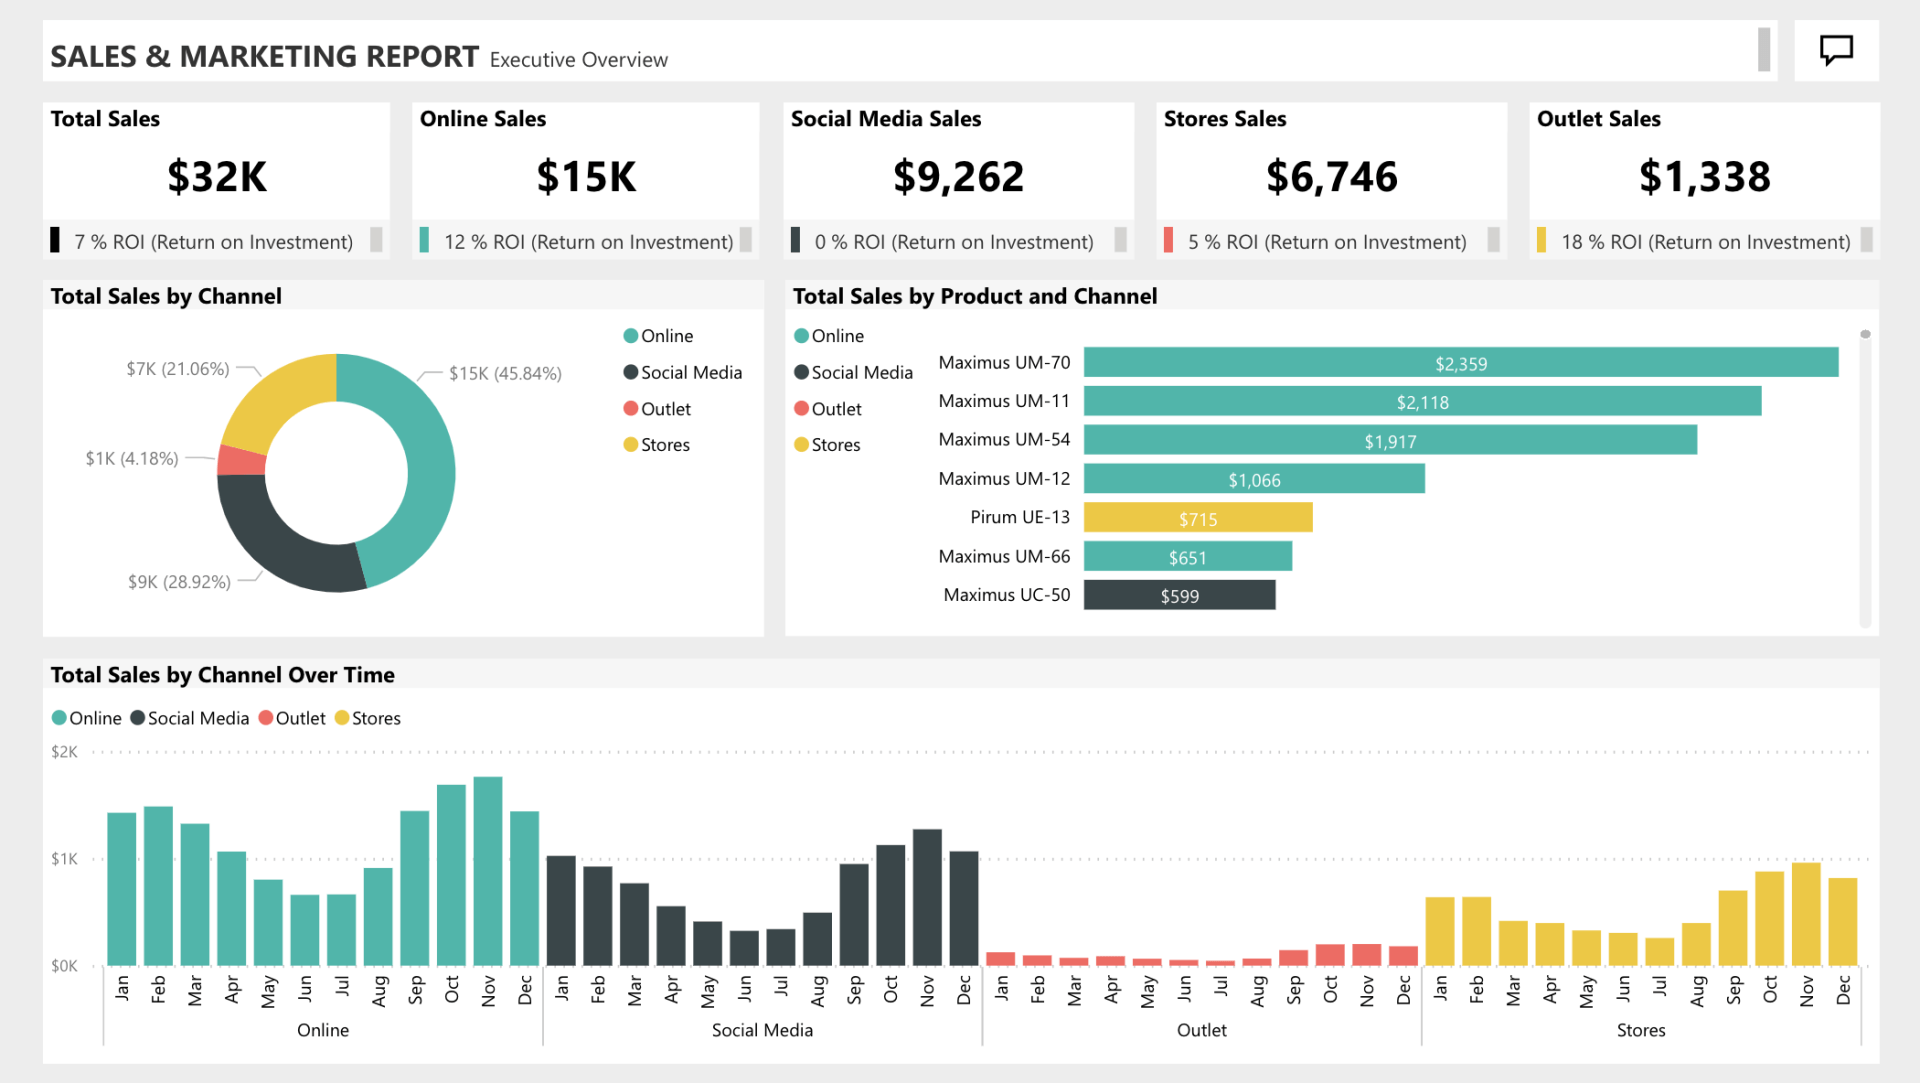
Power BI Offers a Range of Attractive Visualizations
Visualization — the representation of business data in the form of images — is at the core of Microsoft’s Power BI. We love this feature because we can create reports and dashboards with complex or straightforward charts.
There’s also a library from which you can customize your visualizations. Examples of Power BI visualizations include:
● Line chart
● Area chart
● Scatter chart
● Donut chart
● Ribbon chart
● Stacked bar chart
● Map
● Filled map
● Clustered bar chart
● Gauge chart
Easy to Use Reports and Navigation
We also love Power BI because of how easy it is to draft business reports on the platform. A Power BI report is a structured data presentation on different business topics in various formats. In addition, this structure exposes relevant insights from the data. What’s more? Users can use different visualizations for each subject and share their reports with multiple Power BI users.
We find Microsoft Power BI’s Navigation Pane to be pretty intuitive. Who wouldn’t love to navigate datasets, dashboards, and reports easily? Power BI has a feature that lets you easily switch through and between these other features.
For instance, you could be working on a report and quickly switch to a dashboard or specific datasets. It also allows you to work with Microsoft Teams, Microsoft Word, and Microsoft PowerPoint by embedding the product in Power BI.
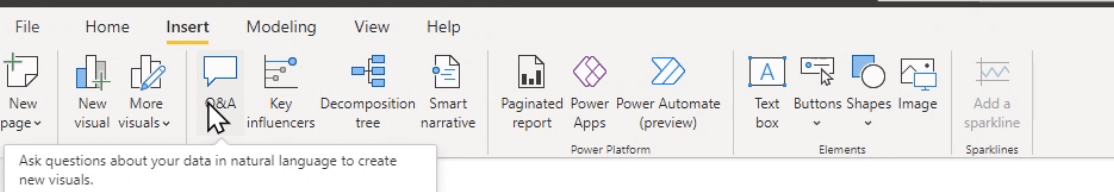
Natural Language Q & A Question Box
Have you tried Power BI’s Natural language Q & A yet? We love it because it enables us ask to questions in everyday language, which is one of the easiest ways to get the insights we need. Why go through all the steps of building a report, when you can simply ask a question to bring it up instantly?
The Natural language Q&A feature in Power BI allows you to type your question in the ‘Ask a question about your data’ box to quickly get answers from your data. Power BI uses cognitive capabilities such as rephrasing, autofill, and suggestions to fetch search results right away.
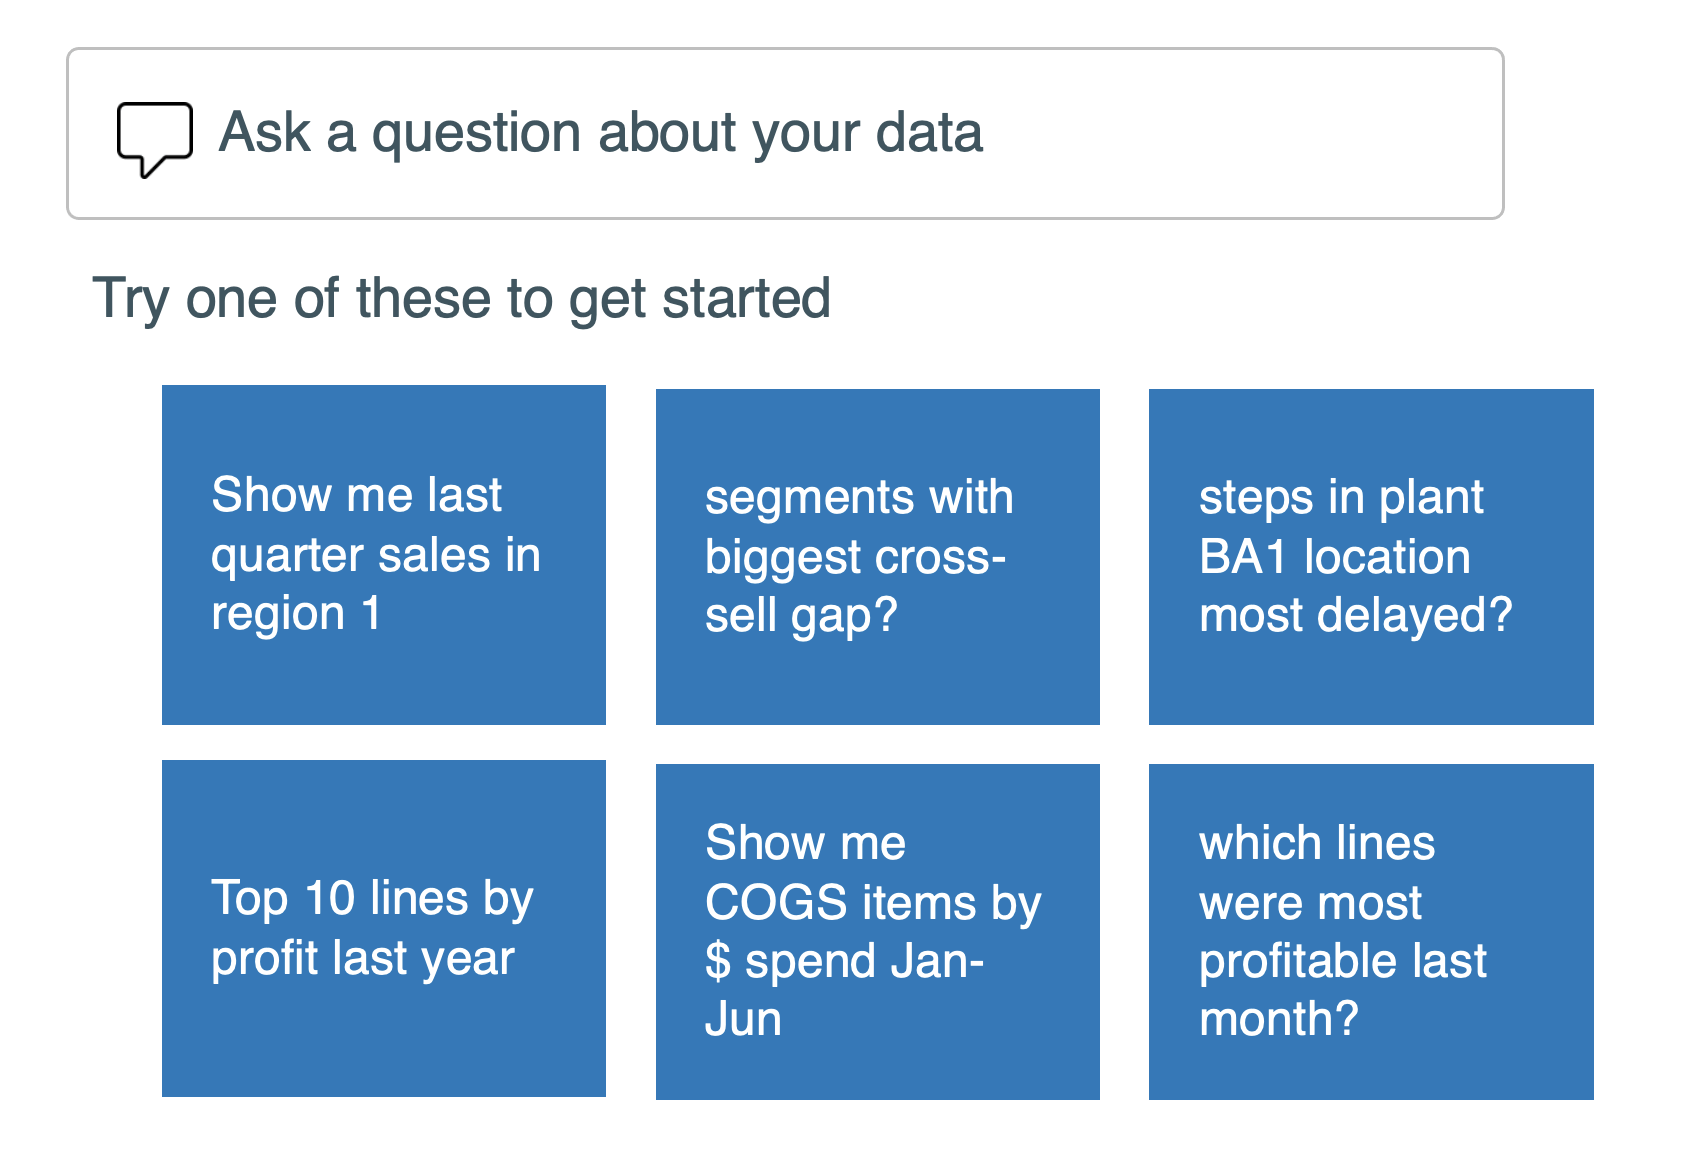
Power BI looks for the best answers based on a pre-configured dataset and reports. It even picks the best visualization to display answers in the most useful way.
You save even more time with the auto complete feature and suggestions for your questions. Power BI also allows you to save frequently asked questions, so they are readily available for other users.
Sparklines
Announced in December 2021, this is one of the most recent updates from Microsoft Power BI. Sparklines are tiny charts that show within tables or matrix cells. These charts make it easy to compare large numbers of trends quickly.
We use like to use Sparklines to show trends in a series of values. For instance, you can represent trends in values of economic cycles. Conversely, you can highlight the minimum and maximum points of your data.
Power BI supports five sparklines per visual and you can display up to 52 points per sparkline. It’s also important to know that the number of columns in any matrix will be limited to 20 whenever your sparklines are on.
Analyze in Excel Feature
At Plus+, we understand that switching to Power BI may be challenging. More so, many people may be resistant to change. That’s why we like Power BI’s “Analyze in Excel” feature. This feature allows users to create their pivot tables in Excel. So, where a Dashboard user needs data for a one-time report, using a generated Excel file works fine.
Notably, you can refresh the Excel file created from this feature. The refresh process then syncs the latest data from the Power BI report. The obvious upside to all these is that Excel pros may find it easier to get onboard the Power BI tech. The setup process is also pretty straightforward.
Additional Power BI Features We Like
Automatic Data Refreshes
Manually refreshing any data form is pretty tedious. So, it’s not surprising that we love Power BI’s automatic refresh tools.
On Power BI, you can automatically refresh datasets quickly and automatically. This way, you can easily see fresh insights and share them with your team. For now, only Power BI Pro and Premium users can enjoy this feature.
Mobile App
Power BI it has an excellent mobile app for Apple, Android, and Windows 10 devices.
Users can view mobile-optimized datasets and reports. They can also share insights with work colleagues from their mobile devices.
The mobile app also lets you set crucial alerts within the app. So, you’re essentially getting the standard Power BI features; they’re just optimized for your mobile devices.
Monthly Product Updates
Updates grant multiple benefits, from enjoying new and improved features to better security. So, using outdated apps is a no-no. Power BI, like other tech solutions, invests in and has released these periodic updates since launching in July 2015.
Microsoft is always working to improve Power BI with new features and other improvements by listening to their global community of Power BI users.
Scale Business Intelligence and Build a Data-Driven Culture With a Strategic Approach From a Microsoft Gold Partner
We are experts in using Microsoft Power BI, Microsoft Azure and Power Apps to connect and modernize data and apps, and build rich data visualizations. We help you design, deploy and automate processes and quickly build apps to solve tough challenges faced in data management. Turn ideas into flexible, adaptable, cost-effective apps and data solutions that scale to meet the growing demands of your business.
Plus+ provides technology and business expertise combined with industry-specific perspectives to help you get the most value from Microsoft Power BI and Power Apps including readiness assessment, strategy and design, implementation, custom application development, and post-launch services to boost adoption and business value.