Enhancing the Reportability of User Activity in ServiceNow

The ability to create reports, graphs and other types of data visualizations within ServiceNow is vast. Between out-of-the-box reporting and ServiceNow’s Performance Analytics feature that allows for more granular and complex logic, there are almost limitless ways to visualize persistent data, all within the ServiceNow platform. One limitation that ServiceNow reporting does have, though, is the difficulty of reporting on user activity and other forms of user interactions with records.
Information gained from being able to report on user activities can be very valuable for a wide range of reasons. From tracking the process and progress of day-to-day operations to gauging user adoption rates of a new portal feature, these insights can help us improve in any number of ways.
Most of the tables holding records related to user interactions and activity such as the Transaction (syslog_transaction) and Audit (sys_audit) tables are, by default, restricted to admin-only access. Additionally, many of these tables are not available for reporting in the standard reporting module due to the complexity of the data held within. If they were available, the information in the tables and the resulting reports would need to be combined with a variety of contextual information sourced from several other tables to be truly coherent and palatable in a report format.
While the standard reporting module has a limit on the number of tables whose data can be combined into a single report, with some knowledge of JavaScript and ServiceNow, there are ways to work around this limitation to create the ideal report for any given situation.
Shift Reports
One way I have been able to work around the limitations to reporting is to write a script that will query the data from all the different source tables, transform the data into something usable and generate a CSV spreadsheet attachment record with the data. After the attachment is generated, it can be attached to a record within ServiceNow or sent via email externally to a specific recipient, depending on the use-case.
For our use-case, we needed to have better insight into the user activity of agents during each shift in the day, so I accomplished this by creating a report for a group of shift managers showing the user activity for each shift in an hour-by-hour format, with the addition of a daily report with an aggregate of each shift’s report. The individual reports are sent shortly after the shift is over directly to the shift manager, and the daily report would be sent each morning, reflecting the previous day’s activity.
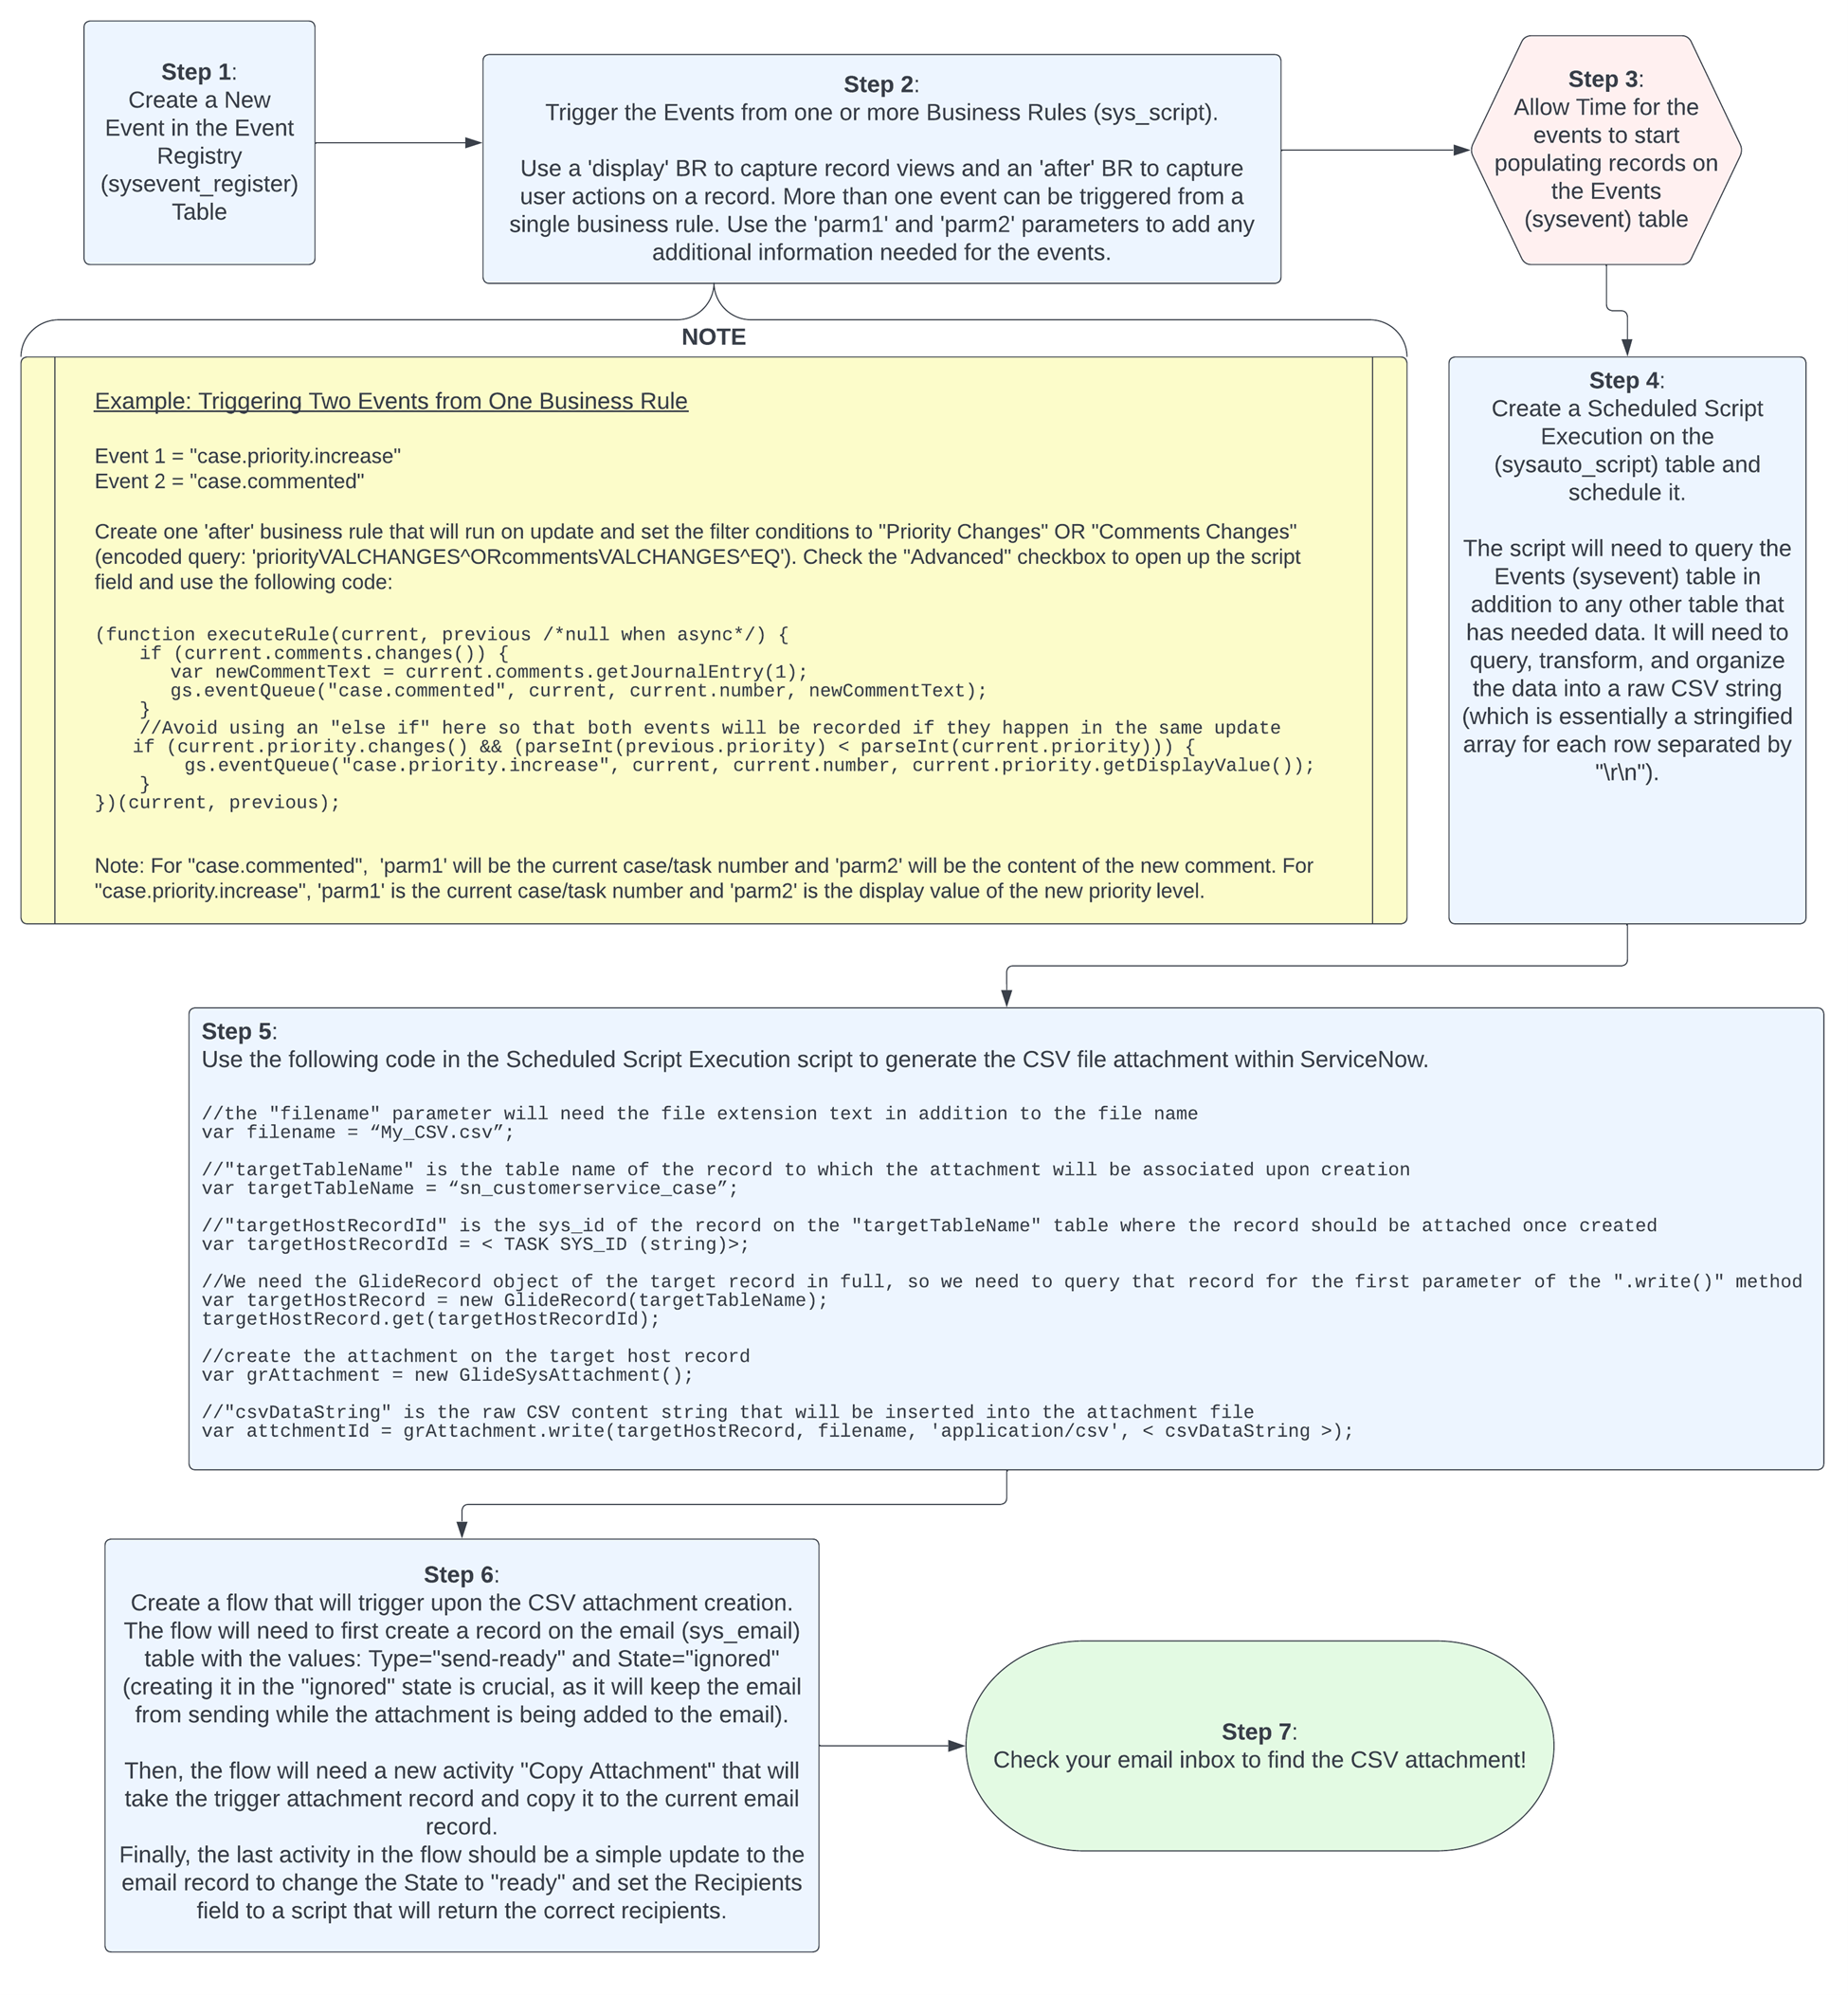
Because most of the data I wanted to aggregate was not implicitly recorded in any specific table, and because the recorded data I needed was often unformatted, the first step I took in the process was to create a group of new events in the Events Registry (sysevent_register) table, one for each interaction that I needed for the report source data. Once the events had been registered, they can be triggered from a business rule.
Different types of events can be triggered in different ways, depending on the desired metric. At ivision, we use cases (sn_customerservice_case table) as our main task type, but this method will work on any task record type in ServiceNow. If I wanted to record how many cases a user has viewed per hour and whether the case was viewed in the standard UI or in Agent Workspace, I could set up an event named something like “case.viewed,” then create a scripted “display” business rule on the case table without any filter conditions. This would cause the script to run every time a record on the case table is opened. The script will initially check the URL of the current page, and if the URL matches an Agent Workspace URL, the event will be triggered with ‘parm1’ being “workspace” and ‘parm2’ being the current user’s name. If the URL does not match an Agent Workspace URL, it will fire with ‘parm1’ being “case” instead of “workspace”. In the events table (sysevent), the exact time, the user, the UI in which the case was viewed and the sys_id of the case that was viewed will be combined into one record that can easily be queried and aggregated. The business rule script will look something like this:
(function executeRule(current, previous /*null when async*/) {
var url = gs.action.getGlideURI();
var name = gs.getUserDisplayName();
if (url.toString().includes(“api/now/graphql?api=api”)) {
gs.eventQueue(“case.viewed”, current, “workspace”, name);
} else {
gs.eventQueue(“case.viewed”, current, “case”, name);
}
})(current, previous);
For another example, if I wanted to record each time a case has a comment added, I would create and register an event called “case.commented”, then set up an ‘after’ business rule with a filter condition of “Comments changes” (encoded query: commentsVALCHANGES^EQ). Within the business rule script, I would write something like the snippet below to record the event on the current record, with ‘parm1’ being the current case number and ‘parm2’ being the comment that was left on the case.
(function executeRule(current, previous /*null when async*/) {
var newComments = current.comments.getJournalEntry(1);
gs.eventQueue(“case.commented”,current,current.number,newComments);
})(current, previous);
Given the flexibility of using events as ways to temporarily record user activity, any number of events can be registered and triggered for pretty much any user action that can be defined programmatically. For my report, I had almost a dozen different events, triggered in many ways from multiple different tables, that when aggregated into a single report, would be able to tell the detailed story of the current shift on a per-user, per-hour basis for the whole shift. Then once a day, a script runs that combines all three shifts’ information into a single report with a higher-level overview of what occurred for that team on that specific day.
I accomplished this by creating two separate Scheduled Script Executions (sysauto_script table), one for the per-shift reports and one for the daily summary report. The daily summary report would run at the end of the last shift in the early hours of the morning and combine the last 24 hours’ worth of events in addition to other data queried directly from their source tables. The per-shift report would send three times a day, two hours after the end of the shift, spaced eight hours apart.
When the scheduled scripts run, they check the current hour and determine which shift should be reported upon, then query data that was recorded using my events and other non-event data during that timeframe by the users on the applicable shift. Using GlideAggregates to transform or aggregate each data point as needed was my preferred method for most of the report columns, as it has a significant performance benefit over using the standard GlideRecord query. Once the data has been collected and calculated, I organize the data into a raw CSV string and use the following code snippet to create a CSV file attachment in ServiceNow and attach it to a record.
var filename = “My_CSV.csv”;
var targetHostRecord = new GlideRecord(“sn_customerservice_case”);
targetHostRecord.get(< TASK SYS_ID >);
//create the attachment on the target host record
var grAttachment = new GlideSysAttachment();
var attchmentId = grAttachment.write(targetHostRecord, < filename >, ‘application/csv’, < csvDataString >);
Once the attachment has been compiled, generated and attached to a record, the “attachmentId” variable will be the new attachment’s sys_id upon successful completion. Using this sys_id, you can copy it from the host record to any other record or manipulate it in a variety of ways. In my case, I decided to build a flow that would be triggered by the creation of the attachment and takes the attachment, creates an email record, determines which shift the report is for, then sends it to the corresponding shift manager. This way, in their email inbox, they are each sent two CSV files per day that they can save and keep for as long as they would like. Using this method, data that once was ephemeral can be recorded and interpreted indefinitely by the person viewing the report.
Case Rollup
Another way I’ve been able to create more temporary reports that show an informational rollup of important data to a case such as who viewed the case and when before it was first assigned, as well as who accepted a case and whether it was accepted via ServiceNow’s Advanced Work Assignment feature.
This report appears as a modal on a case record that can be triggered with a UI Action and contains high-level information about the current case without needing to add fields to the case table. While these reports are temporary to a degree, as the events table automatically resets and clears itself on a set interval (typically seven days), the insights that can be gained from the information in this modal can be invaluable for spotting process improvements and tracking response times, or any other information related to the case.
Creating a task rollup is a relatively simple process with only a few moving parts. Once I had my events and other source data set up and triggering from a business rule, I just needed to create a UI Action (sys_ui_action) on the case table with an ‘onclick’ function that calls a GlideModal using GlideAjax and triggers the generation of the report. The GlideModal being called will correspond to the name of a UI Page (sys_ui_page), which will contain the structure and styling of the modal in Jelly Script and a corresponding client script to populate the Jelly Script. The final piece is a client callable script include (sys_script_include) in the same scope as the UI Action and UI Page, and each function in the script include should be a client-callable query for the information that I wanted to have displayed in the modal. As soon as each piece is configured and the queries are returning data to the modal successfully, then all I needed to do was go to any case record and either click a button or select the UI Action from the context menu, and the modal will run the queries and present the most up-to-date data to the viewer.
Process Flow Diagram for Creating Shift Report CSVs