Supercharge Intune Reporting

You’ve attended Microsoft conferences, you’ve read all the blogs, you’ve heard all the chatter around the Microsoft Modern Desktop. You have even begun the journey to Modern Desktop management using Microsoft Endpoint Manager and Intune. Maybe you’re transitioning from the rock-solid on-premise Configuration Manager using co-management. Or, if you’re coming from some other solution, perhaps you had the opportunity to start directly with Intune. In any case, you’ve now got endpoints that are managed in the cloud! Yay!
One of the very next questions many IT administrators find themselves asking regarding cloud-managed endpoints is, ”Where are all the reports?!” Intune has made some huge strides since it was first released in 2011 (hard to believe it’s been 11 years!), with an impressive list of new features added every week. Unfortunately, it’s still fairly lacking in terms of reporting, especially for those of us from a Configuration Manager background who are used to its plethora of reports. Things are certainly improving, which is a good sign that the Microsoft product team is listening to our feedback. However, there are sometimes when you want a report on a specific item that Intune can’t offer out of the box. Although it may take a little work, fortunately there is a solution!
Log Analytics
Log Analytics is a component of Azure Monitor that, put simply, acts as a bucket to hold data you want to store and report on later. Once the data is stored in your Log Analytics workspace, you can run powerful queries using the Kusto language against the data to get exactly what you want. For those of us coming from Configuration Manager, it is comparable to running database queries using SQL Management Studio.
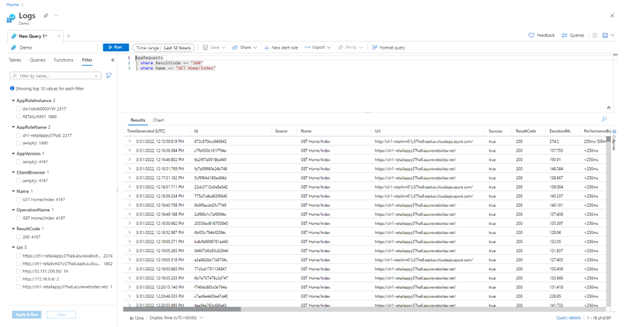
(Photo courtesy of Microsoft)
You can use the Azure Monitor agent to automatically gather information from endpoints and store it in Log Analytics – including Windows event logs from your Windows devices, syslog data from Linux devices, IIS logs and much, much more.
There is a cost to store data in Log Analytics, so be sure to review with your account manager and start with a small dataset first so you can assess the costs.
Update Compliance
If you are in need of detailed information on patch compliance from Intune, look no further than Update Compliance. Update Compliance is a free Azure Marketplace add-on that can be added to your Azure Tenant to provide reporting statistics. Update Compliances requires that endpoints are configured to report their update telemetry information (configurable via MDM policies, Group Policies or script). Under the hood, this telemetry information is uploaded to Log Analytics where you can then report on it using the pre-configured Update Compliance workspace dashboards.
There is no charge for storing Update Compliance data in Log Analytics per Microsoft.
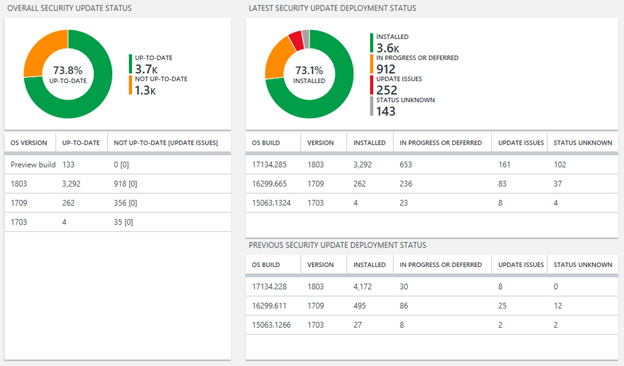
(Photo courtesy of Microsoft)
This report is drillable, so double-clicking on any one of the rows will take you to a Kusto query editor that you can further refine using custom commands.
The amazing folks at MSEndpointmgr.com have created a workbook called the “Update Compliance Community Edition,” which presents the existing Log Analytics data in even more detail. It is definitely worth your time to check out the free workbook to supercharge your update compliance reporting even more.
Collection Custom Data
We mentioned the various ways you can get data into Log Analytics using out-of-the-box or pre-built solutions. But you can also upload any custom data you want using PowerShell scripts and the HTTP Data Collector API. The ability to use scripts running on and endpoint adds limitless possibilities for what kind of data you can collect and store in Log Analytics.
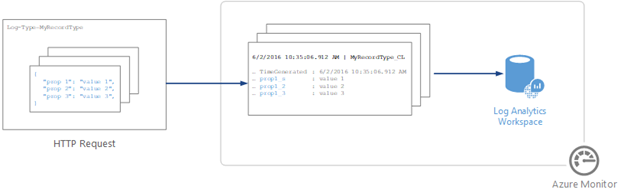
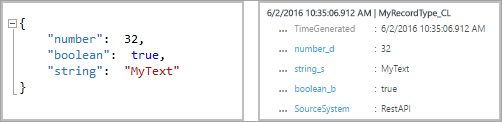
(Photos courtesy of Microsoft)
Proactive Remediations
Now that we know we can write scripts to collect information from an endpoint, how do we run that script on a device from Intune? You may have noticed the Scripts section in the Endpoint Manager portal, but this may not be the ideal section to use. Here, scripts only run once on a machine without the ability for a reoccurring schedule. If you want to get static information from a machine only once, then using the Script section should be fine. However, if you’d like to retrieve this information on an ongoing basis (to monitor when/if the data has changed), then a more suitable solution is to use Proactive Remediations.
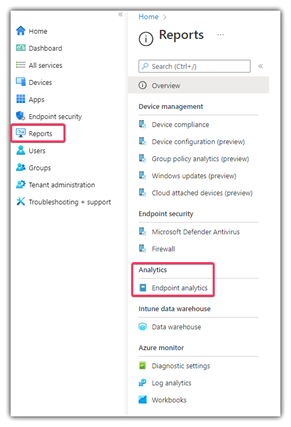
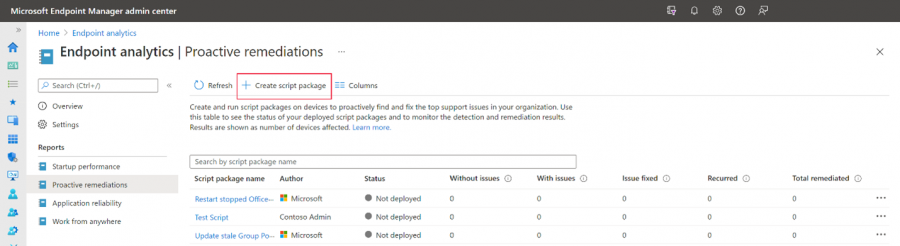
Proactive Remediations can be found somewhat buried in the Endpoint Manager console under the Reports / Endpoint Analytics node.

Proactive Remediations were originally designed to do what its title suggests – perform automated remediations on devices proactively (using PowerShell scripts). It is similar to a Compliance Baseline from the ConfigMgr world or Group Policy in Active Directory where periodic checks are run against a machine and if a setting doesn’t match what is desired then it will be changed to match (i.e. “remediated”).
Proactive Remediations requires the same license as Endpoint Analytics, which is Enterprise E3 or E5 or Education A3 or A5.
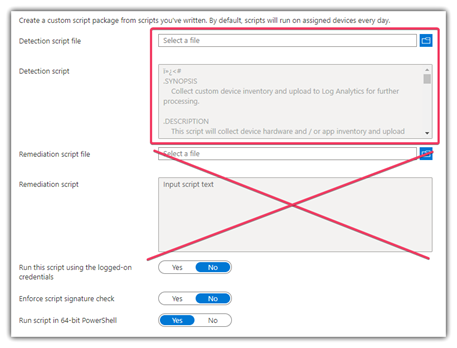
Proactive Remediations are still a fantastic tool for actual remediation. Since it is really just a mechanism to execute our scripts, we can also use it to gather and report or data into Log Analytics for us. When creating a Proactive Remediation in Intune, simply add your data-collection script to the “Detection Script” portion and leave the Remediation script empty.
Then, assign the Proactive Remediation to a target group using a recurring schedule and you are good to go. Depending on what information you are gathering, you may not need to run the script every day if the data doesn’t change that often.
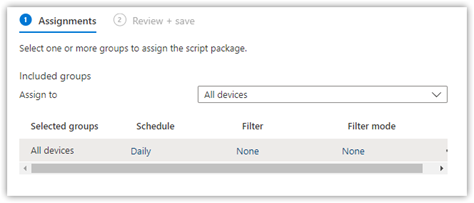
(It is highly recommended to test on a handful of devices before deploying to production!)
Now your endpoints will run your script on a regular basis to gather & store information to Log Analytics. It may take 30-60 minutes before the data gets populated in the workspace. Log Analytics by default will store data for 30 days, but for an additional cost you can increase the retention period.
With all this rich data from your endpoints now stored centrally in Log Analytics, you’ve supercharged your Intune reports! You can use this information to be more informed about your endpoints. All that’s left to do now is to create some dashboards to display the data! But we’ll leave that for next time.