LogicMonitor Versatility: Monitoring, APIs and a Tesla Model 3

One platform. Endless possibilities.
LogicMonitor is known as a leading SaaS performance monitoring platform. This is in part driven by its nearly unlimited extensibility via LogicModules. This flexibility is then amplified by a community of users and staff who push the platform outside of its intended use with some fascinating results. Users can monitor the flow on a Kegerator or track temperatures of BBQ (and more importantly beer) during a friendly BBQ competition.
As you’ll see below, ivision even monitored many different data points exposed via an API for Tesla vehicles. With LogicMonitor, use cases are typically only limited by imagination. So, when their website boasts “One platform. Endless possibilities” – we believe it.

Full monitoring flexibility
LogicMonitor offers native support for both Groovy and PowerShell. This affords us the flexibility to use almost any API with the “Invoke-WebRequest” and “Invoke-RestMethod” cmdlets. With LogicModules, we can natively hook into an application and collect data at a predefined interval. More commonly this would be used to collect data from Exchange, SCCM, or SharePoint servers, but this same functionality can be used to monitor and alert on any application with an API. This allows someone to capture and analyze historical data that may be lost natively through an application with a more restricted (or non-existent) retention policy.
Dashboards offer a place to convert these datasets into visually appealing widgets which streamlines analysis by providing a single pane to digest the information. We can manipulate, calculate, and alert on these same datasets in real time and essentially bring performance monitoring and alerting to an application where this didn’t exist prior. In the case of a Tesla Model 3, we can alert if the battery is low, if the internal temperature is high or if the car exceeds a certain speed.
This could also be used to kick off a “self-healing” script for several different scenarios. One situation is where the internal temperature state would be automatically remediated by setting the desired temperature and turning on the climate control via API until the temperature reached a desirable state. In another, the car locks the doors if the door remains unlocked for a predetermined number of minutes.
Tesla connectivity is the data difference
What sets Tesla apart from all other automakers is their approach toward technology, connectivity, software and the software life-cycle. Compared to traditional auto makers – and in the Silicon Valley spirit – Tesla tends to favor breakneck speed and agility in all their development and manufacturing endeavors.
“At Tesla, if Elon decides he wants a picture of a bunny rabbit on every gauge for Easter, he can have that done in a couple of hours.” – Ashlee Vance
Tesla’s brand tends to represent all-electric, zero-emission, luxury, and exceedingly technical vehicles. It has been described as an energy, technology, and software company that also happens to make cars and it really seems to ring true! Because of Tesla’s advanced technology, using their always-internet-connected model lends to seamless integration using LogicMonitor as a monitoring solution.
Unlike most traditional automobiles, the vehicles are always linked via LTE (or WiFi) to Tesla’s ‘mothership’ (that’s the actual name of Tesla’s server). This connectivity allows for Tesla to know the state of their vehicles at any given moment in time. While users can opt out of sharing most data with Tesla, there is no supported way to take the always-connected vehicles completely offline. With this constant bi-directional data connection, Tesla has the data needed to present a web API allowing vehicle data to be polled and used by a Tesla owner. Since historical data is not presented in any way to the owner, a solution to periodically poll, record and display the data is required to allow any useful performance analysis. That is where LogicMonitor becomes the perfect solution.
LogicMonitor versatility with Tesla API
Tesla’s API exposes many data points via their owner API that have interesting use cases. Some of the ones shown below include location data such as latitude, longitude, heading and velocity. Charging data can be used to validate the battery charging state, times charged and amount of energy added, and calculate the cost of the energy. Because ambient temperature affects battery usage (due to the heating or cooling of the battery), environmental data can check the inside and outside temperatures of the vehicle, which can be used to correlate battery performance.
With this information and the other presented API data points, various aspects of usage can be calculated including estimation of charging costs. Below are examples of Tesla-specific dashboard widgets showing examples of what has been configured and displaying the versatility of what LogicMonitor can accomplish.
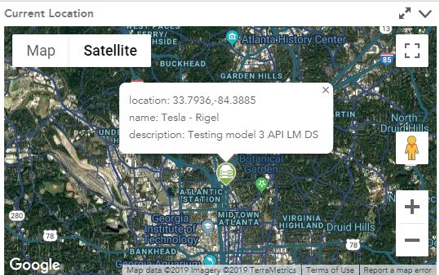
Location Dashboard Widgets:
Using an ivision-created custom script to dynamically update the widget, LogicMonitor takes the vehicle’s latitude and longitude data to update the Google Maps widget with the last reported location and displays it in the dashboard.
More ivision custom code takes the heading data, checks the heading to the nearest 5 degrees and dynamically updates the HTML widget with a custom compass image indicating the last recorded heading.

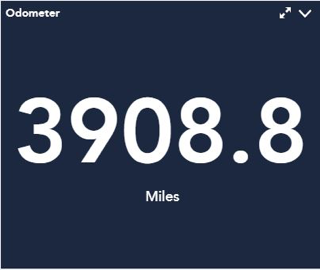
Using a large number widget, LogicMonitor can display the mileage of the vehicle as of the last polling interval. Since LogicMonitor keep historical data, the owner can run reports to see mileage data over time.
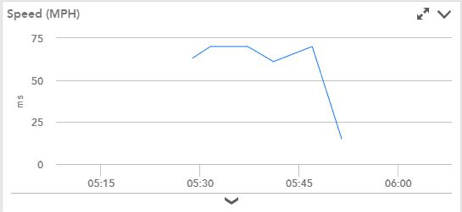
The vehicle also reports its current speed. Using a LogicMonitor graph widget, the owner can see historical trip data and what speeds the vehicle was traveling at in one-minute intervals.
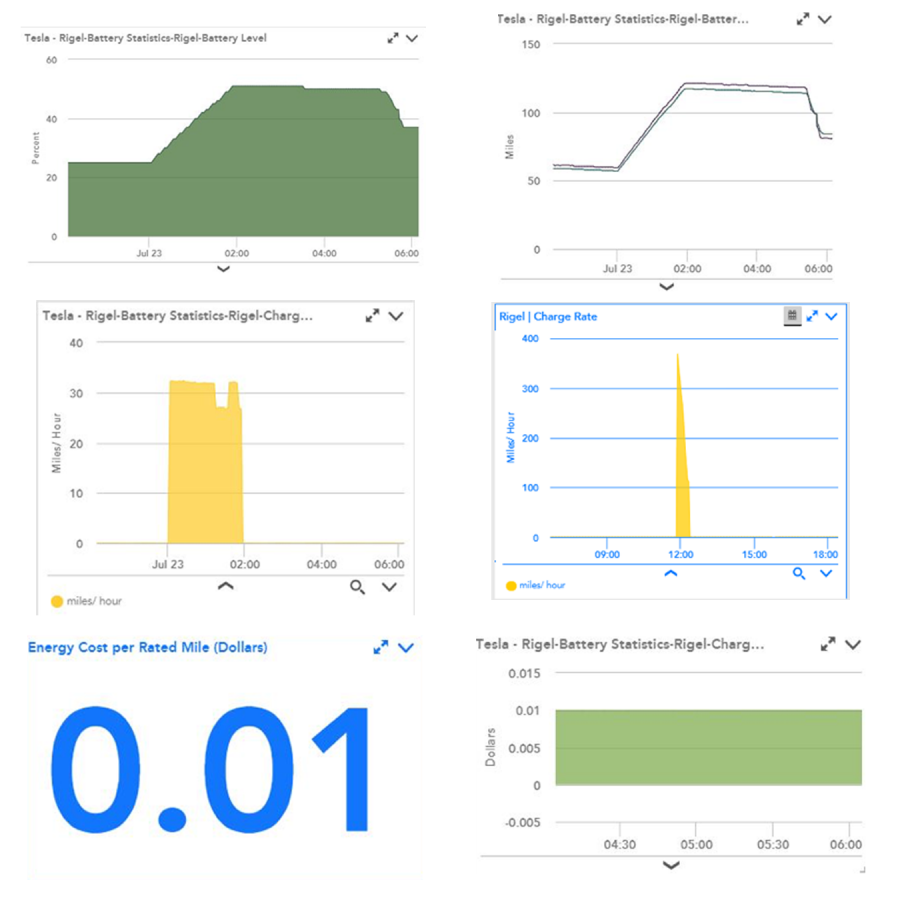
Charging and Usage Dashboard Widgets:
Using data polled from the Tesla owner API, LogicMonitor can record data about charging the battery, charging times and rates, as well as calculating the cost of charging. The rates listed here are based on the owner’s super off-peak rate when charging between 12:00AM and 6:00AM on a charger maxing at about 33 MPH charge rate. In contrast, supercharging looks like a spike with charging rates nearly 400 MPH!
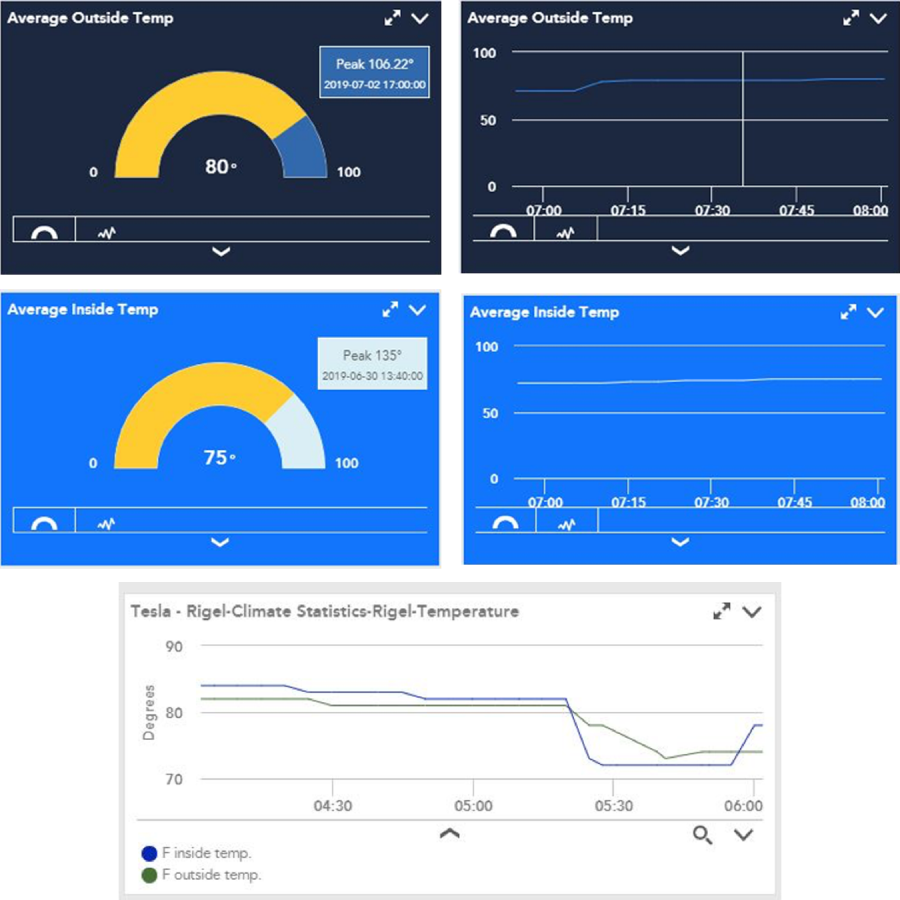
Temperature Dashboard Widgets:
LogicMonitor gathered historical data on the inside and outside temperatures of the vehicle. A gauge/chart widget is used to allow the user to switch between a historical chart and the gauge. LogicMonitor is also set to display the peak temperature based on the data in the timeframe selected in the dashboard setting.
Monitoring for Tesla owners and Tesla dreamers alike
This example of monitoring a Tesla Model 3 is just one singular use case that we found interesting in a sea of endless possibilities. LogicMonitor is truly platform-agnostic: all data ingested via many sources, including an API, can be manipulated, stored and displayed. This single-pane-of-glass approach to displaying the data gives our clients the ability to have a quick view of the health of their monitored environments. LogicMonitor is extremely versatile in its ability to take data from any source and display it in a multitude of ways. Whether you’re looking to monitor the performance of your actual Tesla or monitor your IT infrastructure’s ability to load pictures of your dream Tesla – LogicMonitor is a platform of endless possibilities.